Minerals & Water
Everything you have studied so far — carbohydrate and protein at 4 kilocalories per gram, fat at 9, alcohol at 7 — burns. Minerals and water do not. They yield zero kilocalories per gram, and yet nothing in the body works without them: no heartbeat, no nerve signal, no bone, no thyroid hormone, no oxygen delivery. Minerals are simple inorganic elements the body cannot make and cannot destroy, so they must arrive in food and leave in urine, sweat, and stool. Water is the medium all of it happens in, and it is the nutrient a person runs out of fastest. This chapter walks through the major minerals, the trace minerals, the special case of iron, and the fluid-and-electrolyte system that keeps blood pressure and cell volume where they belong.
By the end of this chapter you can
- Distinguish major minerals from trace minerals and explain why neither yields energy.
- State the main function, a reference intake with its population and units, and the deficiency or toxicity picture for calcium, phosphorus, magnesium, sodium, potassium, and chloride.
- Do the same for the trace minerals iron, zinc, iodine, selenium, and fluoride.
- Explain bioavailability and name specific dietary enhancers and inhibitors of mineral absorption.
- Contrast heme and nonheme iron, describe how absorption is regulated, and sequence the stages from depleted stores to iron-deficiency anemia.
- Describe the functions of body water, account for daily fluid balance, and cite the Adequate Intake for total water by sex.
- Explain how the sodium–potassium pump, osmosis, and hormones distribute fluid between compartments.
- Summarize what the evidence does and does not support about sodium, potassium, and blood pressure, separating strong findings from preliminary ones.
Section 1Major minerals
What a mineral is, and what it is not
A mineral is a single inorganic element — calcium, iron, zinc — that the body needs but cannot synthesize. This makes minerals fundamentally different from the vitamins in the previous chapter. A vitamin is a complex organic molecule that heat, light, oxygen, or long storage can destroy. A mineral is an element: you cannot break calcium down into something that is not calcium. Minerals survive cooking, survive the oven, and survive being burned to ash. What they can do is dissolve, which is why boiling vegetables and pouring off the water leaches potassium and magnesium down the drain.
Because minerals are not oxidized for fuel, they supply 0 kcal per gram. Their value is structural and regulatory: they build the crystal lattice of bone, carry electrical charge across membranes, sit at the active site of enzymes, and hold the osmotic pressure that decides where water goes.
Nutritionists split minerals by how much the body needs, not by how important they are. A major mineral (or macromineral) is one required in amounts greater than 100 mg per day, or present in the body in amounts above about 5 grams. A trace mineral is required in smaller amounts — often milligrams or micrograms. A trace mineral is not a minor mineral: iodine deficiency is measured in micrograms and causes goiter and impaired brain development.
The structural three: calcium, phosphorus, magnesium
Calcium is the most abundant mineral in the body, and roughly 99 percent of it is locked into bone and teeth as hydroxyapatite. The remaining one percent, circulating in blood and inside cells, does the exciting work: muscle contraction, nerve transmission, hormone secretion, and blood clotting. The RDA is 1,000 mg per day for adults 19–50, rising to 1,200 mg per day for women 51 and older and men 71 and older, and it is highest of all in adolescence — 1,300 mg per day for ages 9–18, when the skeleton is being built. Pregnancy in adults does not raise the requirement (still 1,000 mg for ages 19–50), because absorption efficiency increases instead; pregnant and lactating teenagers stay at 1,300 mg. The Tolerable Upper Intake Level is 2,500 mg per day for adults 19–50 and 2,000 mg for adults 51 and older.
Phosphorus partners with calcium in bone, but it is also in every ATP molecule, every phospholipid membrane, and the backbone of DNA and RNA. The RDA is 700 mg per day for adults and 1,250 mg per day for ages 9–18. Dietary deficiency is rare because phosphorus is abundant in protein-containing foods and in phosphate additives; the clinical problem is more often the opposite, when failing kidneys cannot clear phosphate.
Magnesium is a cofactor for more than 300 enzymes, including every reaction that uses ATP — ATP is biologically active as an Mg-ATP complex. About half of body magnesium is in bone. The RDA differs by sex and shifts at age 31: 400 mg per day for men 19–30 and 420 mg for men 31 and older; 310 mg for women 19–30 and 320 mg for women 31 and older, with roughly 40 mg more in pregnancy. Note a quirk: the UL of 350 mg per day applies only to supplemental magnesium, not to magnesium from food, because it is set by the laxative effect of magnesium salts rather than by any harm from food.
The salts of body fluid: sodium, potassium, chloride
These three are the body's principal electrolytes — minerals that dissociate into charged ions in solution and thereby conduct electricity, hold water in place, and maintain acid–base balance. Sodium and chloride dominate the fluid outside cells; potassium dominates the fluid inside them. Because these ions determine osmotic pressure, they determine blood volume, and therefore blood pressure. Section 5 takes that story further.
Their reference values are set as Adequate Intakes rather than RDAs, because the evidence was not strong enough to define an average requirement. For adults, sodium AI is 1,500 mg per day, chloride AI is 2,300 mg per day for ages 19–50 (falling to 2,000 mg at 51–70 and 1,800 mg at 71 and older), and potassium AI is 3,400 mg per day for men 19 and older and 2,600 mg per day for women 19 and older, with 2,900 mg in pregnancy. In its 2019 review, the National Academies replaced the sodium UL with a Chronic Disease Risk Reduction Intake of 2,300 mg per day — a threshold above which reducing intake is expected to reduce chronic disease risk. Average intake in the United States runs near 3,400 mg per day.
| Mineral | Adult reference intake | Main jobs | Food contributors | Deficiency / excess |
|---|---|---|---|---|
| Calcium | RDA 1,000 mg/d (19–50); 1,200 mg/d (women 51+, men 71+); 1,300 mg/d (9–18) | Bone mineral; muscle contraction; nerve signaling; clotting | Dairy, fortified plant beverages, tofu set with calcium, kale, bok choy, canned fish with bones | Low intake over years → reduced peak bone mass, osteoporosis risk; very high supplemental intake → hypercalcemia, kidney stones in susceptible people |
| Phosphorus | RDA 700 mg/d | Bone; ATP; phospholipids; DNA/RNA; buffer | Protein foods, dairy, legumes, whole grains, phosphate additives | Dietary deficiency rare; excess is a problem chiefly in kidney disease |
| Magnesium | RDA 400/420 mg/d men (19–30 / 31+); 310/320 mg/d women | Cofactor for 300+ enzymes; Mg-ATP; nerve and muscle function | Nuts, seeds, legumes, whole grains, leafy greens, some mineral waters | Severe deficiency → neuromuscular irritability, tremor, arrhythmia, resistant hypokalemia and hypocalcemia; supplemental excess → diarrhea |
| Sodium | AI 1,500 mg/d; CDRR 2,300 mg/d | Main extracellular cation; fluid volume; nerve impulse; nutrient co-transport | Packaged and restaurant foods, breads, cured meats, cheese, table salt | Dietary deficiency essentially unknown; hyponatremia arises from losses or excess water; high intake raises blood pressure in salt-sensitive people |
| Potassium | AI 3,400 mg/d men; 2,600 mg/d women | Main intracellular cation; membrane potential; cardiac rhythm | Potatoes, beans, lentils, bananas, oranges, tomatoes, yogurt, leafy greens, fish | Hypokalemia usually from vomiting, diarrhea, or diuretics → weakness, arrhythmia; hyperkalemia is a risk in kidney disease |
| Chloride | AI 2,300 mg/d (19–50) | Extracellular anion; gastric hydrochloric acid; acid–base balance | Table salt and salted foods (accompanies sodium) | Heavy vomiting → hypochloremic metabolic alkalosis |
- Minerals are inorganic elements that supply 0 kcal/g; they are indestructible by heat but can leach into cooking water.
- Major minerals are needed in amounts above 100 mg/day: calcium, phosphorus, magnesium, sodium, potassium, chloride (plus sulfur).
- Calcium RDA is 1,000 mg/d for adults 19–50, 1,200 mg/d for women 51+ and men 71+, and 1,300 mg/d for ages 9–18.
- Sodium, potassium, and chloride carry Adequate Intakes, not RDAs; sodium also carries a CDRR of 2,300 mg/d.
Section 2Trace minerals
Small amounts, large consequences
Trace minerals are needed in milligram or microgram quantities, and the total amount of some of them in an adult body would not cover a fingernail. Their smallness is deceptive. Most trace minerals work as the functional core of a protein: iron sits in the heme group of hemoglobin, zinc holds the shape of hundreds of transcription factors, iodine is built directly into thyroid hormone, and selenium is incorporated as the amino acid selenocysteine into glutathione peroxidase and the enzymes that activate thyroid hormone. Remove a few micrograms and an entire hormone axis stalls.
Because the working range is narrow, trace minerals are also the group where the gap between "not enough" and "too much" is smallest. Selenium is the classic example: the RDA is 55 mcg per day for adults, and the UL is 400 mcg per day — barely seven-fold. Some vitamins have a far wider margin (vitamin E, RDA 15 mg against a UL of 1,000 mg), though others are tight as well (niacin, folate), so the rule is not absolute — the point is that for most trace minerals there is very little room above the requirement.
Five worth knowing well
Iron carries oxygen in hemoglobin and myoglobin and drives electron transport. Its RDA is strongly sex- and life-stage-dependent: 8 mg per day for men 19 and older, 18 mg per day for women 19–50, 8 mg per day for women 51 and older, and 27 mg per day in pregnancy. Section 3 is devoted to it.
Zinc participates in more than 300 enzymes and in the zinc-finger motifs that let transcription factors grip DNA. The RDA is 11 mg per day for men and 8 mg per day for women, rising to 11 mg in pregnancy and 12 mg during lactation; the UL is 40 mg per day. Deficiency shows up as growth faltering in children, delayed wound healing, impaired immune response, loss of taste sensitivity, hair loss, and a characteristic rash. Chronic high-dose supplementation causes a copper deficiency, because zinc induces the intestinal protein that traps copper.
Iodine exists for one purpose: thyroid hormone. The RDA is 150 mcg per day for adults, 220 mcg per day in pregnancy, and 290 mcg per day during lactation, with a UL of 1,100 mcg per day for adults. Deficiency enlarges the thyroid into a goiter and causes hypothyroidism; deficiency during pregnancy impairs fetal brain development and has historically been the leading preventable cause of intellectual disability worldwide. Excess iodine can also disturb thyroid function, so the dose–response curve is U-shaped.
Selenium defends cells against oxidative damage through glutathione peroxidase and activates thyroid hormone through the deiodinases. RDA is 55 mcg per day for adults (60 mcg in pregnancy, 70 mcg during lactation), UL 400 mcg per day. Deficiency is regional and tied to selenium-poor soils; in parts of China it produced Keshan disease, a cardiomyopathy. Toxicity, called selenosis, produces brittle nails, hair loss, garlic-smelling breath, and gastrointestinal upset.
Fluoride is the outlier: it is not required for life, but it measurably strengthens tooth enamel against acid demineralization. The AI is 4 mg per day for men 19 and older and 3 mg per day for women, with a UL of 10 mg per day for adults. The evidence that fluoride reduces dental caries is strong and long-standing. Too much during the years when permanent teeth are forming produces dental fluorosis — white flecking to brown mottling of enamel — which is why fluoride intake in young children is watched closely.
Bioavailability: the label number is not the absorbed number
Bioavailability is the fraction of an ingested nutrient that is actually absorbed and usable. For minerals it can swing enormously depending on what else is on the plate. Phytate (phytic acid) in whole grains, legumes, nuts, and seeds binds zinc, iron, calcium, and magnesium; oxalate in spinach, rhubarb, and beet greens binds calcium so tightly that spinach is a poor calcium source despite a high calcium number on paper. Working the other way, vitamin C sharply increases nonheme iron absorption, and soaking, sprouting, fermenting, and leavening with yeast all reduce phytate and raise mineral availability — which is a large part of why traditional food preparation methods around the world involve exactly those steps.
Minerals also compete. Large supplemental doses of one divalent mineral can crowd out another at shared intestinal transporters — zinc against copper, calcium against iron, iron against zinc. This competition is a supplement-dose phenomenon; it is not something that ordinary mixed meals produce.
| Trace mineral | Adult reference intake | Adult UL | Key role | Deficiency | Excess |
|---|---|---|---|---|---|
| Iron | RDA 8 mg/d men; 18 mg/d women 19–50; 8 mg/d women 51+; 27 mg/d pregnancy | 45 mg/d | Hemoglobin, myoglobin, electron transport | Depleted stores → iron-deficiency anemia (microcytic, hypochromic) | Hereditary hemochromatosis; acute overdose is a leading poisoning of young children |
| Zinc | RDA 11 mg/d men; 8 mg/d women; 11 mg/d pregnancy | 40 mg/d | 300+ enzymes; zinc-finger transcription factors; immune function | Growth faltering, poor wound healing, impaired immunity, taste loss, rash | Nausea; induced copper deficiency with chronic high doses |
| Iodine | RDA 150 mcg/d adults; 220 mcg/d pregnancy; 290 mcg/d lactation | 1,100 mcg/d | Thyroid hormone synthesis | Goiter, hypothyroidism; impaired fetal neurodevelopment | Thyroid dysfunction — the curve is U-shaped |
| Selenium | RDA 55 mcg/d adults; 60 mcg/d pregnancy; 70 mcg/d lactation | 400 mcg/d | Glutathione peroxidase; thyroid hormone activation | Keshan cardiomyopathy in selenium-poor regions | Selenosis: brittle nails, hair loss, garlic breath |
| Fluoride | AI 4 mg/d men; 3 mg/d women | 10 mg/d | Strengthens enamel against demineralization | More dental caries | Dental fluorosis during tooth formation; skeletal fluorosis at very high chronic intakes |
- Trace minerals are needed in mg or mcg amounts and usually act inside a specific protein — heme, a zinc finger, thyroid hormone, selenocysteine.
- The gap between deficiency and toxicity is narrow: selenium RDA 55 mcg/d versus UL 400 mcg/d.
- Iodine deficiency causes goiter and, in pregnancy, impaired fetal brain development; needs rise to 220 mcg/d in pregnancy.
- Bioavailability is modified by phytate, oxalate, vitamin C, food preparation, and competition between minerals at shared transporters.
Section 3Iron and anemia
Two forms of dietary iron
Iron arrives in food in two chemically distinct forms, and they behave so differently that they are absorbed by separate pathways. Heme iron is iron already held inside a porphyrin ring, released from the hemoglobin and myoglobin of meat, poultry, and fish. It is taken up intact by the intestinal cell and absorbed at roughly 15 to 35 percent — efficiently, and largely indifferent to whatever else is in the meal. Nonheme iron is free ionic iron, and it is what you get from plants, eggs, dairy, and enriched or fortified grains. Its absorption ranges from about 2 to 20 percent and is exquisitely sensitive to the rest of the meal.
Most dietary iron in most diets is nonheme, even in people who eat meat. That is why the modifiers matter so much. Vitamin C reduces ferric iron to the absorbable ferrous form and holds it in solution; a citrus fruit, tomatoes, or peppers eaten with a bean dish can multiply the iron absorbed from it. A separate, still incompletely characterized enhancer in meat, poultry, and fish — historically called the MFP factor — increases nonheme absorption from the same meal. Pulling the other direction are phytates in whole grains and legumes, polyphenols and tannins in tea and coffee, calcium in large supplemental doses, and oxalates. Because the DRI committee accounted for this, the iron requirement for people eating no meat, poultry, or fish is estimated at roughly 1.8 times the standard RDA.
Absorption is the control valve
Here is the fact that organizes all of iron physiology: the body has no regulated route for excreting iron. Small amounts are lost in shed skin and gut cells, in menstrual blood, and in any bleeding, but there is no hormone that tells the kidney to dump excess iron. Iron balance is therefore controlled almost entirely at the point of absorption.
The gatekeeper is a liver hormone called hepcidin. When body iron is plentiful — or when inflammation is present — hepcidin rises, binds the export protein ferroportin on intestinal and macrophage membranes, and degrades it, so absorbed iron stays trapped in the mucosal cell and is shed when that cell sloughs off. When iron is scarce, hepcidin falls, ferroportin persists, and more iron enters the blood, where transferrin carries it to the marrow. Storage is as ferritin, mostly in liver, spleen, and marrow.
The same logic explains two clinical realities. First, iron supplements taken in large doses are poorly and increasingly inefficiently absorbed, because a big dose transiently drives hepcidin up. Second, in chronic inflammatory disease, hepcidin stays high and iron is locked away in storage even though the marrow needs it — the anemia of inflammation, which is a different problem from dietary iron deficiency and is not fixed the same way.
From depleted stores to anemia
Iron deficiency is not an on/off state. It develops in stages, and anemia is the last one, which means a person can be meaningfully iron-depleted with a completely normal hemoglobin.
| Stage | What is happening | What changes in the labs | Symptoms |
|---|---|---|---|
| 1. Depleted stores | Ferritin stores are being drawn down | Serum ferritin falls; hemoglobin still normal | Usually none |
| 2. Early functional deficiency | Transport iron drops; the marrow starts to run short | Transferrin saturation falls, total iron-binding capacity rises, erythrocyte protoporphyrin rises | Fatigue may begin |
| 3. Iron-deficiency anemia | Red cells are made small and pale for lack of iron | Hemoglobin and hematocrit fall; MCV below about 80 fL (microcytic), hypochromic | Fatigue, pallor, breathlessness on exertion, cold intolerance, sometimes pica |
The groups at greatest risk follow directly from the physiology: menstruating people, pregnancy (RDA 27 mg per day), infants and toddlers, adolescents in a growth spurt, frequent blood donors, people with gastrointestinal blood loss, and people eating no meat, poultry, or fish. Iron deficiency remains the most common single nutrient deficiency worldwide.
| Enhances nonheme iron absorption | Inhibits nonheme iron absorption |
|---|---|
| Vitamin C in the same meal | Phytates in whole grains, legumes, nuts, seeds |
| MFP factor from meat, poultry, fish | Polyphenols and tannins in tea, coffee, some herbs |
| Low body iron stores (low hepcidin) | High-dose calcium supplements taken with the meal |
| Acid gastric environment | Oxalates; high-dose zinc supplements; high hepcidin from inflammation |
- Heme iron (meat, poultry, fish) absorbs at about 15–35 percent; nonheme iron at about 2–20 percent and is heavily modified by the meal.
- The body cannot regulate iron excretion, so absorption is the control point, governed by hepcidin and ferroportin.
- Deficiency progresses: depleted stores (low ferritin) → early functional deficiency → microcytic, hypochromic anemia.
- Iron RDA is 18 mg/d for women 19–50, 8 mg/d for men and for women 51+, and 27 mg/d in pregnancy; the adult UL is 45 mg/d.
Section 4Water

What water does
Water is the nutrient the body needs in the largest quantity and can survive without for the shortest time — days, against weeks without food. It makes up roughly 50 to 70 percent of body weight, and the variation is mostly a matter of tissue composition rather than anything else: lean tissue is about 73 percent water while adipose tissue holds much less, so people with more lean mass have a higher percentage. Infants are the wettest, near 70–75 percent, and the proportion declines gradually across the lifespan, which is one reason dehydration is a more serious threat at the two ends of life.
Its jobs are so basic they are easy to overlook. Water is the universal solvent in which nearly every metabolic reaction occurs, and it is a direct participant: every hydrolysis reaction in digestion consumes a water molecule. It is the transport medium — blood plasma, lymph, urine. It regulates temperature, because water has an unusually high heat capacity and heat of vaporization, so evaporating a modest volume of sweat sheds a large amount of heat. It lubricates and cushions as synovial fluid, cerebrospinal fluid, mucus, tears, and amniotic fluid. And because it carries the electrolytes, it maintains blood volume and therefore blood pressure.
Body water is divided into two compartments. Roughly two-thirds is intracellular fluid (ICF), inside cells, and one-third is extracellular fluid (ECF) — the interstitial fluid between cells plus the plasma inside vessels. Water moves freely between them by osmosis, following whichever side has the higher concentration of dissolved particles. Nothing pumps water; water always follows solute.
Where it comes in, where it goes out
Intake has three sources. Beverages of all kinds supply roughly 80 percent of total water intake, and this includes coffee and tea — the mild diuretic effect of caffeine at ordinary intakes does not outweigh the fluid the drink itself provides. Food supplies most of the remainder, since fruits and vegetables can be 85–95 percent water and even bread is about a third water. A small final contribution is metabolic water, roughly 250–350 mL per day, produced as a byproduct when carbohydrate, fat, and protein are oxidized.
Output has four routes. Urine is the only one that is finely regulated, and the kidney must produce a minimum of roughly 500 mL per day — the obligatory water loss — simply to carry out the day's urea, sodium, and other solutes. Insensible losses through skin and exhaled air run near 700–1,000 mL per day and continue whether you notice them or not. Sweat is small at rest and enormous during heat and exertion, sometimes exceeding a liter per hour. Feces account for only 100–200 mL in health, but that figure rises dramatically in diarrheal illness, which is why diarrhea is a leading cause of dehydration deaths in young children worldwide.
Two hormone systems keep the ledger balanced. Osmoreceptors in the hypothalamus sense rising blood concentration and trigger thirst plus release of antidiuretic hormone (ADH, vasopressin), which tells the kidney to reabsorb water. Falling blood volume or pressure activates the renin–angiotensin–aldosterone system, and aldosterone makes the kidney retain sodium — water follows the sodium osmotically.
How much? The honest answer
The Adequate Intake for total water — from beverages plus food combined — is 3.7 L per day for men 19 and older and 2.7 L per day for women 19 and older. About 3.0 L and 2.2 L of those respective totals come from beverages, with food supplying the balance. In pregnancy the total-water AI is 3.0 L per day, and during lactation it is 3.8 L per day.
Two cautions about those numbers. First, they are population Adequate Intakes drawn from what generally healthy people consume; they are not a target every individual must hit. Real requirements swing widely with air temperature, humidity, altitude, physical activity, fever, illness, and body size. Second, the familiar "eight glasses a day" rule is not a DRI and has no clear origin in the evidence; eight 8-ounce glasses is about 1.9 L, which is in the right neighborhood for beverages for some women and low for many men, and it ignores food entirely. For most healthy adults, thirst plus drinking with meals tracks needs well. The important exception is older adults, in whom the thirst response is genuinely blunted, so thirst becomes a less reliable signal.
| Water in (typical adult, mL/day) | Amount | Water out | Amount |
|---|---|---|---|
| Beverages | ~1,500–2,500 | Urine (regulated; minimum ~500) | ~1,000–2,000 |
| Food | ~700–1,000 | Insensible: skin and lungs | ~700–1,000 |
| Metabolic water from oxidation | ~250–350 | Sweat (at rest) | ~100–500; heat or exertion can add >1,000 per hour |
| — | — | Feces (much higher in diarrhea) | ~100–200 |
- Water is 50–70 percent of body weight, about two-thirds intracellular and one-third extracellular; water moves by osmosis, following solute.
- Functions: solvent and reactant, transport, temperature regulation, lubrication and cushioning, blood volume.
- The total-water AI is 3.7 L/day for men and 2.7 L/day for women (3.0 L in pregnancy, 3.8 L in lactation), including water from food.
- Thirst and ADH defend concentration; aldosterone defends volume. Thirst is blunted in older adults.
Section 5Electrolytes and fluid balance
Ions, compartments, and the pump that keeps them apart
An electrolyte is a mineral salt that dissociates into ions in water. Sodium (Na+) and chloride (Cl−) are the dominant ions of extracellular fluid; potassium (K+), magnesium, and phosphate dominate inside the cell. Plasma sodium is normally about 135–145 mEq/L and plasma potassium about 3.5–5.0 mEq/L — and notice how narrow that potassium window is, which is exactly why potassium disturbances threaten the heart.
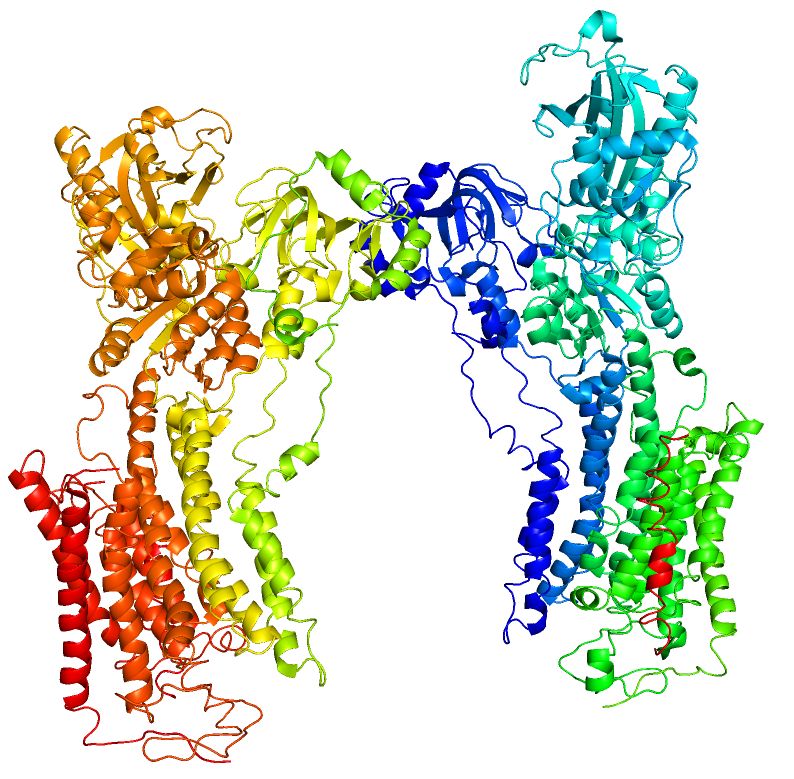
That separation is not passive; it is bought with energy. The sodium–potassium pump (Na+/K+-ATPase) in every cell membrane exports three sodium ions and imports two potassium ions per molecule of ATP. Running this pump consumes a substantial share of resting energy expenditure — estimates vary by tissue and by method, but it is a continuous, non-negotiable cost. The payoff is the membrane potential that makes nerve impulses and muscle contraction possible, and the sodium gradient that powers the intestinal co-transporters for glucose and amino acids — which, incidentally, is the physiological principle behind oral rehydration solution containing both salt and sugar.
Because water follows solute by osmosis, the distribution of these ions decides the distribution of fluid. Retain sodium and the extracellular compartment expands; lose sodium and it shrinks. This is the mechanical link from a mineral to a vital sign.
Sodium, potassium, and blood pressure
This is one of the most heavily studied questions in nutrition, so it is worth separating what is well established from what is still being worked out.
Strong evidence. Reducing sodium intake lowers blood pressure on average. This comes from many randomized controlled feeding trials, pooled in multiple meta-analyses, and the effect is consistent. The magnitude is modest at the individual level and larger in specific groups: people who already have hypertension, older adults, and Black adults tend to show bigger reductions — a trait called salt sensitivity. The DASH–Sodium trial demonstrated that lowering sodium and following an eating pattern rich in fruits, vegetables, and low-fat dairy each lowered blood pressure, and that the two effects added together.
Moderate evidence. Higher potassium intake also lowers blood pressure in randomized trials, but the base here is thinner than for sodium and is usually graded moderate rather than strong: the effect is clearest in adults who already have hypertension and whose sodium intake is high, and is small or inconsistent in adults with normal blood pressure. Tellingly, when the National Academies reviewed potassium in 2019 they judged the chronic-disease evidence insufficient to set a CDRR — unlike sodium, which did receive one. The direction of effect is nonetheless consistent with the idea that the two ions act on the same system from opposite directions.
Preliminary evidence. Whether lowering sodium reduces heart attacks and strokes — not just blood pressure — rests on a thinner base, because the trials required are long and expensive. Long-term follow-up of the Trials of Hypertension Prevention found fewer cardiovascular events in the sodium-reduction groups, and a large trial of potassium-enriched salt substitute in rural China reported fewer strokes and deaths. Those are encouraging, but they are a small number of trials in specific populations, and generalizing them to everyone would be overstating the case. Observational work suggesting that the sodium-to-potassium ratio predicts risk better than either ion alone is similarly plausible but not proven, since observational data cannot separate the ratio from everything else that accompanies a potassium-rich diet.
What is genuinely uncertain. Whether very low sodium intakes carry risk of their own is still argued, and the studies on both sides have measurement problems — estimating a person's habitual sodium intake accurately is notoriously hard. Honest teaching says so.
Where the sodium actually comes from
Roughly 70 percent of sodium in the United States food supply is already in packaged, processed, and restaurant foods before anyone reaches for a salt shaker — in bread, cured meats, cheese, soups, sauces, and savory snacks. Table salt added at home and at the table is a minority contributor. One teaspoon of table salt contains about 2,300 mg of sodium, since salt is roughly 40 percent sodium by weight, which is why food labels list sodium and not salt.
That distribution matters for how the topic should be framed. Sodium intake is largely a property of the food supply rather than a personal failing, and reformulation by manufacturers moves population intake far more than individual vigilance does. Salt is also not a villain: it is the vehicle for iodine in iodized salt, it makes food palatable, and food that people do not want to eat has no nutritional value at all. The useful skill is reading a Nutrition Facts label and knowing roughly where a day's total lands — not anxiety about any single meal.
| Ion | Where it dominates | Typical plasma range | Reference intake (adults) | Relationship to blood pressure |
|---|---|---|---|---|
| Sodium | Extracellular fluid | 135–145 mEq/L | AI 1,500 mg/d; CDRR 2,300 mg/d | Higher intake raises blood pressure on average; effect largest in salt-sensitive groups (strong evidence) |
| Potassium | Intracellular fluid | 3.5–5.0 mEq/L | AI 3,400 mg/d men; 2,600 mg/d women | Higher intake lowers blood pressure, most in those with hypertension and high sodium intake (moderate evidence — smaller trial base than sodium) |
| Chloride | Extracellular fluid | 98–107 mEq/L | AI 2,300 mg/d (19–50) | Accompanies sodium; sodium chloride raises pressure more than sodium with other anions |
| Na/K ratio | — | — | No DRI set | Lower ratio associated with lower risk (observational — preliminary) |
- Sodium and chloride rule the extracellular fluid; potassium rules the intracellular fluid, a separation maintained by the Na+/K+-ATPase (3 Na out, 2 K in, per ATP).
- Water follows solute osmotically, so sodium balance sets extracellular volume and therefore blood pressure.
- Strong evidence: lowering sodium lowers blood pressure. Moderate evidence: raising potassium lowers it too, mainly in people with hypertension. Weaker evidence: the size of the resulting reduction in cardiovascular events.
- About 70 percent of dietary sodium comes from packaged and restaurant foods; 1 teaspoon of salt is about 2,300 mg sodium.
The chapter in one breath
- Minerals are inorganic elements that supply 0 kcal/g (versus carbohydrate and protein at 4, fat at 9, alcohol at 7) yet are required for structure, signaling, and enzyme function.
- Major minerals — calcium, phosphorus, magnesium, sodium, potassium, chloride — are needed above 100 mg/day; calcium RDA is 1,000 mg/d for adults 19–50, 1,200 mg/d for women 51+ and men 71+, and 1,300 mg/d for ages 9–18.
- Trace minerals work in mcg-to-mg amounts inside specific proteins, and their deficiency-to-toxicity window is narrow — selenium RDA 55 mcg/d against a UL of 400 mcg/d.
- Bioavailability is the real variable: phytate, oxalate, tannins, and mineral–mineral competition reduce absorption; vitamin C, MFP factor, and soaking, sprouting, or fermenting increase it.
- Iron comes as well-absorbed heme (15–35 percent) and meal-sensitive nonheme (2–20 percent); because iron excretion is unregulated, hepcidin controls balance at absorption.
- Iron deficiency runs depleted stores → early functional deficiency → microcytic, hypochromic anemia, so a normal hemoglobin does not rule out depletion — and not every anemia is iron.
- Water is 50–70 percent of body weight and serves as solvent, transport, coolant, cushion, and reactant; total-water AI is 3.7 L/day for men and 2.7 L/day for women, including food.
- Electrolytes set fluid distribution: lowering sodium lowers blood pressure (strong evidence), raising potassium does too but on a smaller trial base and mainly in people with hypertension (moderate evidence), while the effect of either on cardiovascular events rests on fewer trials still (weaker evidence).
ReferenceWords worth knowing
A quick reference for the terms in this chapter — skim it now, or circle back whenever a word trips you up.
- Adequate Intake (AI)
- A reference intake used when evidence is insufficient to set an RDA; based on observed intakes of apparently healthy groups. Sodium, potassium, chloride, fluoride, and water all use AIs.
- Bioavailability
- The proportion of an ingested nutrient that is actually absorbed and available for use — for minerals, heavily modified by the rest of the meal.
- Chronic Disease Risk Reduction Intake (CDRR)
- A reference value introduced in 2019 for sodium (2,300 mg/day for adults), marking an intake above which reduction is expected to lower chronic disease risk.
- Dental fluorosis
- White flecking to brown mottling of tooth enamel caused by excess fluoride during the years permanent teeth are forming.
- Electrolyte
- A mineral salt that dissociates into charged ions in solution, conducting electricity and governing fluid distribution; chiefly sodium, potassium, and chloride.
- Extracellular fluid (ECF)
- Body water outside cells — interstitial fluid plus blood plasma; about one-third of total body water, dominated by sodium and chloride.
- Ferritin
- The storage form of iron and the usual laboratory marker of iron stores; also an acute-phase reactant, so inflammation can falsely raise it.
- Goiter
- Enlargement of the thyroid gland, classically from iodine deficiency as the gland strains to make hormone without its raw material.
- Heme iron
- Iron bound within a porphyrin ring, found in meat, poultry, and fish; absorbed at roughly 15–35 percent and largely unaffected by other meal components.
- Hepcidin
- A liver hormone that controls iron absorption by degrading ferroportin; it rises with high iron stores and with inflammation, shutting the gate.
- Hyponatremia
- Blood sodium below the normal range, from sodium loss or from excess water; symptoms range from headache and nausea to confusion and seizures.
- Insensible water loss
- Unnoticed daily water loss through the skin and exhaled air, roughly 700–1,000 mL per day in an adult at rest.
- Intracellular fluid (ICF)
- Body water inside cells; about two-thirds of total body water, dominated by potassium, magnesium, and phosphate.
- Iron-deficiency anemia
- The final stage of iron depletion, in which hemoglobin falls and red cells are microcytic (MCV below about 80 fL) and hypochromic.
- Major mineral (macromineral)
- A mineral required in amounts greater than 100 mg per day: calcium, phosphorus, magnesium, sodium, potassium, chloride, sulfur.
- Metabolic water
- Water generated as a byproduct of oxidizing carbohydrate, fat, and protein — roughly 250–350 mL per day.
- Nonheme iron
- Free ionic iron from plants, eggs, dairy, and fortified grains; absorbed at roughly 2–20 percent and strongly modified by enhancers and inhibitors.
- Phytate (phytic acid)
- A phosphorus storage compound in whole grains, legumes, nuts, and seeds that binds zinc, iron, calcium, and magnesium and lowers their absorption.
- Salt sensitivity
- The tendency for blood pressure to change appreciably with sodium intake; more common with existing hypertension, older age, and among Black adults.
- Sodium–potassium pump
- The Na+/K+-ATPase, which moves three sodium ions out and two potassium ions into the cell per ATP, maintaining the membrane potential.
- Tolerable Upper Intake Level (UL)
- The highest daily intake unlikely to cause harm in almost all people; exceeding it raises risk of toxicity, as with selenium above 400 mcg/day.
- Trace mineral
- A mineral required in amounts below 100 mg per day, including iron, zinc, iodine, selenium, copper, manganese, fluoride, chromium, and molybdenum.