Food Security & Sustainability
Every other chapter in this book asks what a nutrient does inside a body. This one asks a harder question: whether the food carrying that nutrient ever reaches the body at all. Food security is the difference between knowing what a person should eat and their being able to eat it — and it is shaped by income, transportation, time, geography, harvest, war, and price far more than by knowledge or willpower. At the same time, the system that grows and moves that food is the single largest human pressure on land, fresh water, and the climate, which means the way we feed eight billion people now determines how easily we can feed them later. This chapter looks at both ends of that problem: who is missing food today, and what the food system costs to run.
By the end of this chapter you can
- Define food security and its four dimensions, and describe the food security continuum used to measure it.
- Summarize the prevalence and documented health consequences of food insecurity across the lifespan.
- Distinguish stunting, wasting, and underweight, and explain why the first 1,000 days matter so much.
- Describe the major micronutrient deficiencies of global public health importance, with their RDAs and deficiency syndromes.
- Trace a food from production to plate and identify where nutrients, food, and money are lost along the way.
- Compare the environmental footprint of major food groups and explain why what you eat outweighs how far it travelled.
- Explain how fortification, biofortification, and food assistance programs work, and which have strong evidence behind them.
- Separate strong evidence from preliminary evidence when evaluating claims about diets and sustainability.
Section 1Food security and insecurity
What food security actually means
Food security exists when all people, at all times, have physical, social, and economic access to sufficient, safe, and nutritious food that meets their dietary needs and food preferences for an active and healthy life. That definition, from the 1996 World Food Summit, is worth reading slowly, because every clause is doing work. All times rules out a household that eats well three weeks a month and runs out in the fourth. Economic access makes clear that food sitting on a shelf a person cannot afford does not count. Food preferences acknowledges that a culturally unacceptable food is not a real option. And safe reminds us that contaminated food is not food.
Researchers break the concept into four dimensions, and a household can fail on any one of them independently. Availability asks whether enough food physically exists in the area. Access asks whether this household can obtain it — money, transportation, distance, and time all live here. Utilization asks whether the body can actually use the food, which brings in food safety, clean water, cooking facilities, and whether infection or disease is stealing nutrients. Stability asks whether the other three hold up over time rather than collapsing at the end of the month or the end of a growing season.
Measuring it: a continuum, not a switch
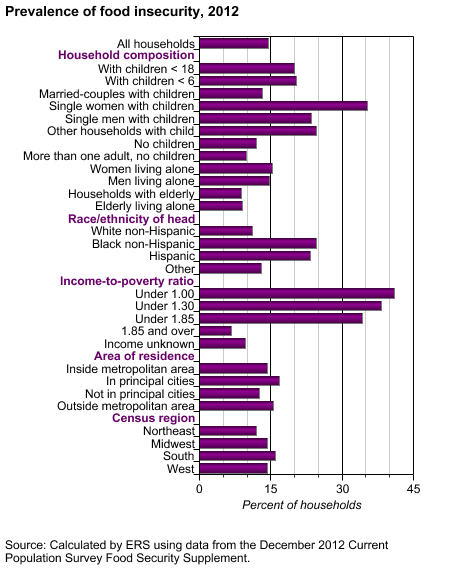
Food insecurity is not a synonym for hunger, and it is not a yes-or-no state. In the United States it is measured with a household survey module that sorts households along a continuum — 18 items for households with children, 10 for those without. High food security means no reported problems. Marginal food security means anxiety about food supply but no real change in diet or intake. Low food security means reduced quality, variety, or desirability of the diet, with little or no reduction in the amount eaten. Very low food security means eating patterns were actually disrupted and intake reduced — skipped meals, smaller meals, whole days without eating — because there was not enough money for food. The first two categories are counted as food secure; the last two are counted as food insecure.
| Category | Diet quality | Amount eaten | Counted as |
|---|---|---|---|
| High food security | Normal | Normal | Food secure |
| Marginal food security | Normal, but anxiety about running out | Normal | Food secure |
| Low food security | Reduced quality and variety | Little or no reduction | Food insecure |
| Very low food security | Reduced | Reduced — meals skipped or missed | Food insecure |
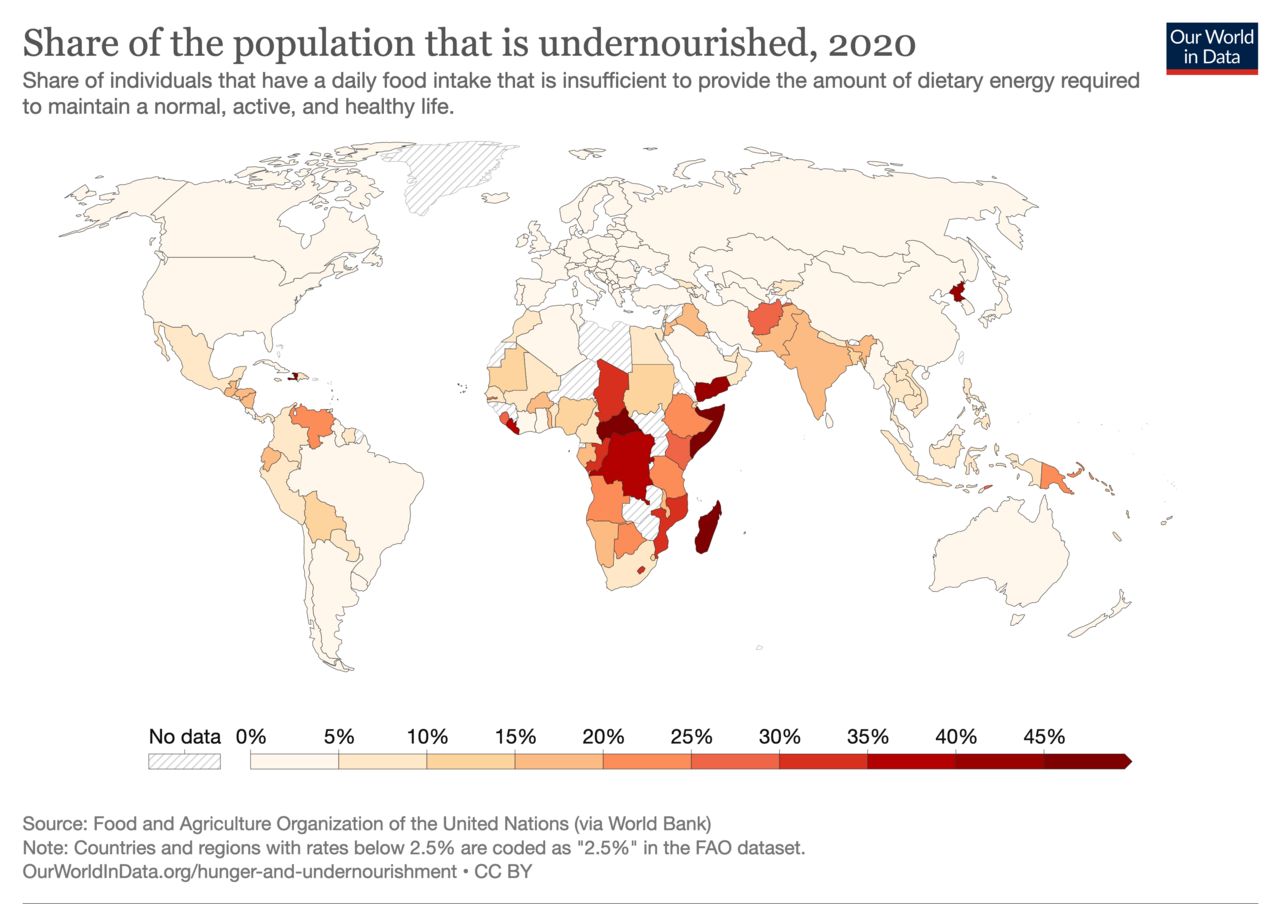
Internationally, the parallel instrument is the Food Insecurity Experience Scale (FIES), an eight-question module used by the Food and Agriculture Organization to compare countries. Recent global estimates put roughly 2.3 billion people at moderate or severe food insecurity, and around 700–800 million people — close to one in eleven — as chronically undernourished, meaning habitual intake below the energy required for a normal active life. In the United States, roughly one in eight households reports food insecurity in a given year, with about one in twenty reaching very low food security. These figures shift year to year with prices, employment, and the generosity of assistance programs, so always check the current release rather than quoting a number from memory.
What food insecurity does to health
The evidence linking food insecurity to worse health is strong and consistent, though most of it is observational, so causal direction runs both ways: illness makes households poorer, and poverty makes households sicker. In children, food insecurity is associated with iron deficiency, more frequent illness, poorer school performance, and higher rates of anxiety and behavioral difficulty. In adults, it is associated with higher rates of type 2 diabetes, hypertension, and depression, and with markedly worse control of chronic disease — a person rationing insulin and food in the same month has a predictable outcome. Older adults face an added layer, because fixed incomes, limited mobility, and medication costs collide.
One finding surprises students: food insecurity is often associated with higher body weight in some populations, particularly among women. This is not a paradox once you look at the mechanics rather than reaching for a judgment. Energy-dense, shelf-stable foods cost less per calorie and waste less; cycles of scarcity and relative plenty change eating patterns; chronic stress alters appetite regulation and sleep; and cooking requires time, equipment, and utilities that may not be there. The physiology is ordinary. The environment is the variable. Describing it any other way — as a failure of discipline or of taste — is both unkind and factually wrong.
- Food security = reliable access to enough safe, nutritious, acceptable food; its four dimensions are availability, access, utilization, and stability.
- Food insecurity is a continuum: high, marginal, low, and very low food security — the last two count as food insecure.
- Roughly one in eight U.S. households and about 2.3 billion people globally experience some level of food insecurity.
- Food insecurity tracks with worse chronic disease control, poorer child development, and higher rates of depression; associations with higher body weight reflect cost and access, not character.
Section 2Global malnutrition
Malnutrition means more than "too little"
Malnutrition is any deficiency, excess, or imbalance in energy or nutrient intake. It therefore covers three overlapping problems: undernutrition (not enough energy or protein), micronutrient deficiency (not enough of a specific vitamin or mineral), and diet-related chronic disease. Many countries now carry two of these at once in the same communities and sometimes in the same household — a stunted child and an adult with type 2 diabetes under one roof. That pattern is called the double burden of malnutrition, and it exists because cheap energy became widely available faster than cheap nutrient density did.
Stunting, wasting, and the first 1,000 days
Child undernutrition is classified by comparing a child to the WHO Child Growth Standards, using how many standard deviations (a z-score) they sit from the median. Stunting is low height-for-age below −2 SD: it reflects chronic, cumulative deprivation and is the marker of long-run damage. Wasting is low weight-for-height below −2 SD: it reflects acute, recent loss and carries the highest near-term mortality risk. Underweight is low weight-for-age and mixes the two, which is why it has largely been replaced by the more specific measures. In the field, mid-upper arm circumference (MUAC) is used as a fast screening measure in children 6–59 months, and the presence of bilateral pitting edema is by itself sufficient to classify severe acute malnutrition regardless of any measurement.
| Measure | Definition | What it tells you | Time frame |
|---|---|---|---|
| Stunting | Height-for-age < −2 SD | Chronic deprivation; linked to cognitive and economic outcomes | Long-term |
| Wasting | Weight-for-height < −2 SD | Acute deficit; highest short-term mortality risk | Recent |
| Underweight | Weight-for-age < −2 SD | Composite — cannot separate the two above | Mixed |
| Severe acute malnutrition | WHZ < −3, MUAC < 115 mm, or bilateral pitting edema | Medical emergency requiring structured treatment | Acute |
Roughly 150 million children under five are stunted worldwide and about 45 million are wasted. The reason stunting gets so much attention is timing. The first 1,000 days — from conception to a child's second birthday — is the window in which the brain, the immune system, and linear growth are laid down. Deficits accumulated in that window are only partially recoverable afterward, and long-term cohort studies consistently associate them with reduced school attainment and lower adult earnings — associations that are strong and reproducible, though the observational designs cannot fully separate early nutrition from the poverty that usually accompanies it. It is one of the few places in nutrition where the phrase "critical period" is literally true rather than rhetorical.
The two classic severe syndromes are still worth knowing by name. Marasmus is severe wasting from grossly inadequate energy intake: the child is emaciated, with loss of subcutaneous fat and muscle, and no edema. Kwashiorkor presents with bilateral pitting edema, an enlarged fatty liver, and characteristic skin and hair changes. Kwashiorkor was historically attributed to protein deficiency with adequate energy, and that framing persists in many textbooks, but the mechanism is not settled — oxidative stress, aflatoxin exposure, and gut microbiome differences have all been implicated. Treat the protein-deficiency story as a useful teaching heuristic, not an established cause. Both syndromes are treated under medical supervision, and reintroducing food carries its own danger: refeeding syndrome, in which the shift back to carbohydrate metabolism drives phosphate, potassium, and magnesium into cells and can precipitate cardiac and neurologic collapse. This is a hospital-managed problem, not something to improvise.
Hidden hunger: micronutrient deficiency
A person can eat enough calories and still be badly deficient, which is why micronutrient deficiency is called hidden hunger. Five deficiencies dominate global public health. Values below are Recommended Dietary Allowances (RDAs) for healthy people; they differ by age and sex and rise in pregnancy and lactation, so always match the value to the population.
| Nutrient | Adult RDA (19–50 y) | Pregnancy | Deficiency syndrome |
|---|---|---|---|
| Iron | 8 mg/day men; 18 mg/day women (falls to 8 mg/day after menopause) | 27 mg/day | Microcytic, hypochromic anemia; fatigue; impaired work capacity |
| Vitamin A | 900 µg RAE/day men; 700 µg RAE/day women | 770 µg RAE/day | Night blindness, Bitot spots, xerophthalmia, keratomalacia; higher infection mortality |
| Iodine | 150 µg/day adults | 220 µg/day | Goiter; in pregnancy, congenital hypothyroidism and irreversible neurodevelopmental harm |
| Zinc | 11 mg/day men; 8 mg/day women | 11 mg/day | Growth faltering, impaired immunity, prolonged diarrhea, poor wound healing |
| Folate | 400 µg DFE/day adults | 600 µg DFE/day | Megaloblastic anemia; neural tube defects when deficient around conception |
Two more deserve mention because they are the historical face of nutritional disease. Thiamin deficiency causes beriberi — "wet" beriberi with high-output heart failure and edema, "dry" beriberi with peripheral neuropathy — and, in the context of chronic alcohol use, Wernicke encephalopathy. Niacin deficiency causes pellagra, remembered as the three Ds: dermatitis in sun-exposed skin, diarrhea, and dementia. Both were epidemic in populations dependent on a single staple grain, though by different routes: beriberi followed polished (milled) rice, which loses the thiamin-rich bran, while pellagra followed maize-based diets, in which niacin is bound in a form the body cannot absorb unless the grain is treated with alkali as in traditional nixtamalization. Both largely vanished from industrialized countries once staple grains were enriched — a point we return to in Section 5.
- Malnutrition spans undernutrition, micronutrient deficiency, and diet-related chronic disease; many countries carry a double burden.
- Stunting (height-for-age) marks chronic deprivation; wasting (weight-for-height) marks acute risk; MUAC and bilateral edema screen for severe acute malnutrition.
- The first 1,000 days is a genuine critical window — deficits there are only partly recoverable.
- Iron, vitamin A, iodine, zinc, and folate are the deficiencies of greatest global public health importance; RDAs differ by age, sex, and pregnancy.
Section 3The food system: from production to plate
The stages, and what leaks out of each
A food system is everything involved in getting food from the ground to a person and dealing with what is left over: inputs (seed, water, fertilizer, fuel, labor), production, post-harvest handling and storage, processing, distribution and transport, retail, preparation and consumption, and waste. Nutrition students often study only the last two stages, which is a mistake — the price, safety, and nutrient content of what lands on a plate were largely determined upstream.
Loss is enormous and it happens at both ends. Roughly 13 percent of food produced is lost between harvest and retail, mostly to inadequate storage, cooling, and transport — a problem of infrastructure, concentrated in lower-income settings. A further 19 percent or so is wasted at retail, food service, and household level, with households the single largest slice, concentrated in higher-income settings. Combined, close to a third of the food grown is never eaten, along with the land, water, fuel, and labor that produced it.
| Stage | What happens | Where it goes wrong |
|---|---|---|
| Inputs | Seed, water, soil, fertilizer, fuel, labor | Cost volatility; fertilizer runoff; groundwater depletion |
| Production | Farming, fishing, livestock rearing | Drought, flood, pests, conflict, crop failure |
| Post-harvest & storage | Drying, cooling, warehousing | Spoilage, pests, mycotoxins — the big loss point in low-income settings |
| Processing | Milling, canning, freezing, fortifying | Nutrient loss in refining; also where fortification becomes possible |
| Distribution | Transport, cold chain, wholesale | Cold-chain breaks; fuel cost passed to price |
| Retail | Stores, markets, food service | Low-access areas; price and shelf-space shape what is bought |
| Consumption | Storage, cooking, eating | Household waste; unsafe temperatures; leaching of water-soluble vitamins |
Processing: not one thing
"Processed" is one of the least useful words in nutrition because it collapses opposite things. Pasteurizing milk, freezing peas within hours of picking, canning tomatoes, drying beans, and adding folic acid to flour are all processing, and each of them makes food safer, cheaper, more available, or more nutritious. Freezing in particular often preserves vitamin C and folate better than a fresh product that spent days in transit and storage. Refining, by contrast, removes: milling a whole grain strips the bran and germ, taking most of the fiber, magnesium, vitamin E, and much of the B-vitamin and iron content with them.
The current research focus is on ultra-processed foods, formulations built largely from industrial ingredients and additives rather than recognizable whole foods. Here it is important to separate evidence tiers. Large observational cohorts consistently associate higher ultra-processed intake with higher rates of cardiometabolic disease — that association is strong and reproducible, but observational, and confounded by income, smoking, and overall diet. Direct experimental evidence is thin: the best-known controlled feeding trial enrolled about twenty adults for a few weeks. The classification itself is also contested, since it groups mass-produced bread with candy. Treat the mechanism as preliminary, and be skeptical of anyone who states it as settled in either direction.
The food environment
Where food is sold determines what gets eaten as reliably as any nutrition label. Low-access areas — often called food deserts — are neighborhoods where the nearest full grocery store is far enough away that a household without a car realistically shops at a convenience store. Many communities also experience the opposite density problem, a high concentration of inexpensive prepared food and few fresh options. Some scholars prefer the term food apartheid to emphasize that these patterns follow historical policy decisions about zoning, lending, and transit rather than natural geography. Layer on price — energy-dense foods are consistently cheaper per calorie than nutrient-dense ones — and the shape of a household's diet becomes largely predictable from its zip code and income.
Food safety belongs here too, since it is the utilization dimension of food security made concrete. The WHO estimates roughly 600 million foodborne illnesses and 420,000 deaths per year worldwide. Most of what prevents them is unglamorous: handwashing, separating raw and ready-to-eat foods, cooking to adequate internal temperature, and keeping food out of the 40–140 °F (4–60 °C) range where bacterial growth is fastest.
- A food system runs from inputs through production, storage, processing, distribution, retail, consumption, and waste.
- About 13 percent of food is lost before retail and roughly 19 percent wasted after — close to a third of all food grown.
- Processing includes both nutrient-preserving steps (freezing, canning, fortification) and nutrient-removing ones (refining); the word alone tells you nothing.
- Observational evidence linking ultra-processed foods to disease is strong; the causal mechanism remains preliminary.
Section 4Sustainable eating and the footprint of food
The scale of the problem
Food production is the largest way humans touch the planet. Agriculture occupies roughly half of habitable land, accounts for about 70 percent of global freshwater withdrawals, and food systems as a whole generate somewhere near a quarter to a third of anthropogenic greenhouse gas emissions. Agriculture is also the dominant driver of biodiversity loss and of deforestation. The implication is that a diet has an environmental cost the same way it has a nutritional profile, and the two do not always point in the same direction.
The most useful evidence base here is life-cycle assessment (LCA), which tallies emissions, land, and water across a product's whole chain. A landmark 2018 synthesis covering roughly 38,000 farms across 119 countries produced the ranking below. The numbers are approximate and vary widely by production system, so read them as orders of magnitude rather than precise values.
| Food | Approx. kg CO2e per kg food | Land use | Note |
|---|---|---|---|
| Beef (beef herd) | ~60–100 | Very high | Enteric methane plus land conversion dominate |
| Lamb | ~25–40 | Very high | Also a ruminant — same methane pathway |
| Cheese | ~20–24 | High | Roughly 10 kg of milk per kg of cheese |
| Pork / farmed fish | ~7–14 | Moderate | Feed composition drives most of it |
| Poultry / eggs | ~4–10 | Moderate | Most efficient common animal foods (eggs at the low end, poultry meat at the high end) |
| Tofu / other legumes | ~1–3 | Low | Nitrogen-fixing crops need little fertilizer |
| Grains, roots, most vegetables | ~0.4–1.7 | Low | Rice is the exception (~4) — flooded paddies emit methane; air-freighted perishables also break the pattern |
What actually moves the needle
Three findings from this literature are robust enough to rely on. First, the type of food dominates. The spread between the highest- and lowest-impact foods is on the order of fifty- to a hundredfold — beef sits near 100 kg CO2e per kg while peas sit near 1 — which is far larger than the (still substantial) spread between the best and worst producers of the same food. Second, transport is a minor term for most foods — on the order of 6 percent of food-related emissions overall, though the exact share depends on where the analysis draws its system boundary. "Food miles" is therefore a poor guide: a legume shipped across an ocean by sea generally beats local beef by a wide margin. The real exception is highly perishable produce moved by air, which is a small share of trade but carries an outsized footprint. Third, reducing waste is a free win, because wasted food carries every upstream cost with it and delivers nothing.
Comparing per kilogram of food can mislead when foods serve different purposes, so researchers often normalize per gram of protein or per 100 kcal. Doing so narrows some gaps and widens others, but it does not reverse the basic ordering: ruminant meat sits at the top, legumes and grains at the bottom. Where evidence is genuinely preliminary is the claim that particular grazing or "regenerative" systems sequester enough soil carbon to offset ruminant emissions. Some systems do sequester meaningful carbon, but soil carbon saturates, the measurements are difficult, and current evidence does not support treating it as a general offset.
Eating sustainably without moralizing
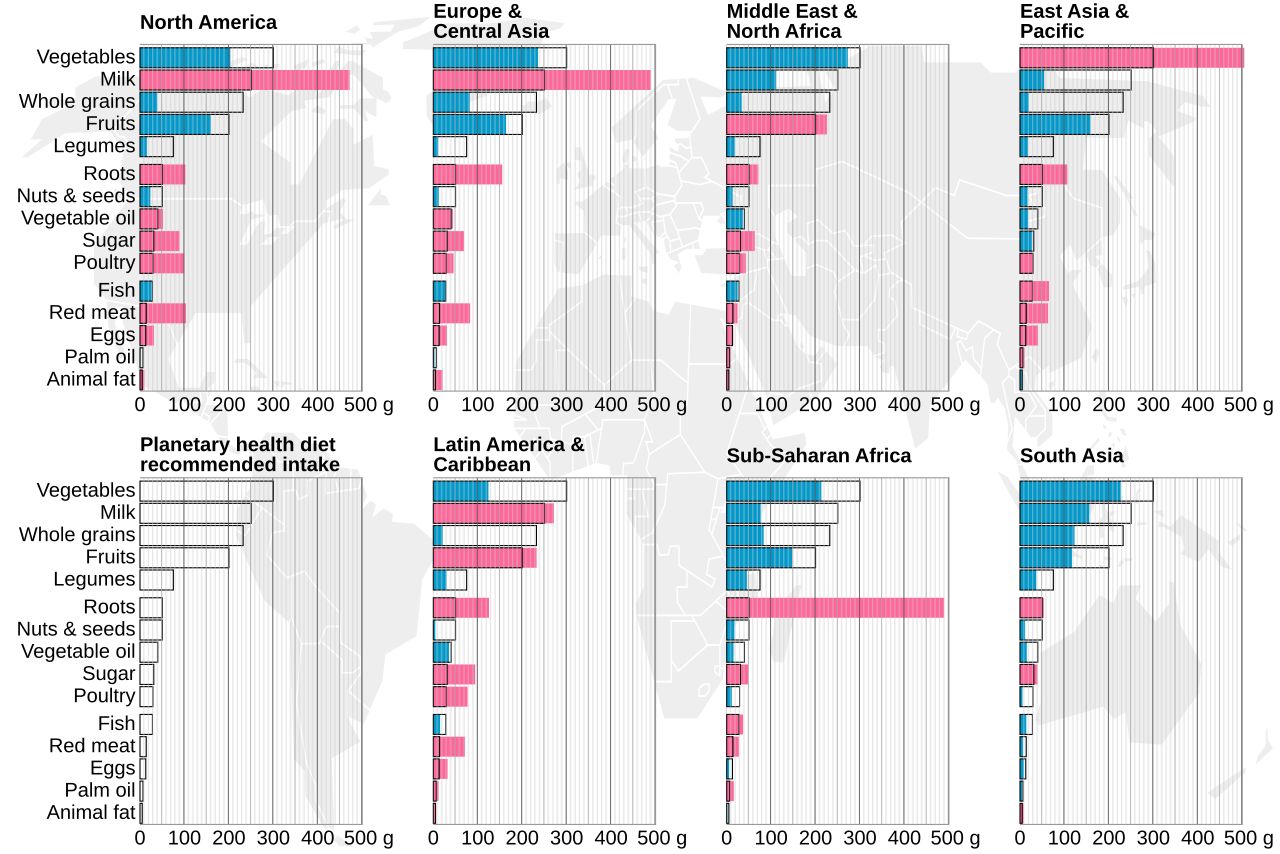
The most-cited reference scenario is the planetary health diet published by the EAT-Lancet Commission: a roughly 2,500 kcal pattern that is largely plants, with modest amounts of animal foods, designed to sit within estimated environmental limits while meeting nutrient needs. It is a modeling exercise for global averages, not a personal prescription, and its authors say so. Applied bluntly it can be unaffordable and culturally inappropriate, and it does not automatically supply enough iron, zinc, calcium, vitamin B12, or omega-3 fats for every individual without attention to food choices or supplementation.
A more honest framing is that sustainability is a matter of ratios and margins, not moral categories. Shifting some meals toward legumes, choosing poultry or fish where a ruminant would otherwise appear, using frozen and canned foods, buying imperfect produce, and simply throwing away less all produce measurable gains without declaring any food forbidden. Foods are not virtuous or sinful, and neither are the people eating them. Cost, time, culture, allergy, and appetite are legitimate constraints, and advice that ignores them is advice that will not be followed.
- Food systems use about half of habitable land and roughly 70 percent of freshwater withdrawals, and generate roughly a quarter to a third of greenhouse gas emissions.
- Food type matters far more than food miles; transport is around 6 percent of food emissions.
- Ruminant meats sit at the high end of the footprint range and legumes, grains, and vegetables at the low end — a spread on the order of fifty- to a hundredfold.
- Claims that regenerative grazing offsets ruminant emissions are preliminary and should not be treated as established.
Section 5Programs and solutions

Food assistance: the income layer
The dominant lever against food insecurity in high-income countries is not education. It is money. The largest U.S. program, the Supplemental Nutrition Assistance Program (SNAP), provides an electronic benefit that households spend on groceries, and it reaches roughly 40 million people in a typical month. Because it works through purchasing power, its effects on food insecurity are relatively fast and well documented; when benefit levels rise, measured food insecurity falls, and when they lapse, it rises.
Other programs target specific windows of risk. WIC serves pregnant and postpartum people, infants, and children under five with a prescribed food package, breastfeeding support, and nutrition services — and it has among the strongest evidence bases of any nutrition program, with consistent associations with improved birth outcomes and better dietary quality. That evidence is largely observational rather than randomized — withholding a benefit for a trial is rarely ethical — so it carries some risk of selection effects, but the findings hold across many designs and decades. School meal programs feed children where they already are, and universal-eligibility approaches remove the stigma and paperwork that suppress participation. Emergency food — food banks and pantries — is the visible face of the response, but it was designed as a supplement for short crises and cannot substitute for stable income.
| Program type | Who it reaches | How it works | Strength of evidence |
|---|---|---|---|
| SNAP-style benefits | Low-income households broadly | Purchasing power for groceries | Strong — benefit changes track food insecurity |
| WIC-style packages | Pregnancy, infants, children under 5 | Prescribed foods plus counseling and lactation support | Strong for birth outcomes and diet quality |
| School meals | School-age children | Meals at the point of attendance; universal eligibility raises uptake | Strong for participation and daily intake |
| Congregate / home-delivered meals | Older adults | Meals plus a daily social contact | Moderate — also addresses isolation |
| Food banks and pantries | Anyone in acute need | Donated and rescued food, distributed locally | Fills gaps; not a substitute for income |
| Produce prescriptions / medically tailored meals | Patients with diet-sensitive conditions | Clinic-referred food benefit | Preliminary — promising, mostly small or observational studies |
Fortification: the quiet giant
Fortification is the addition of nutrients to a food that did not originally contain them in that amount; enrichment specifically restores nutrients lost during processing. Both work through the food supply rather than through individual behavior, which is exactly why they succeed — no one has to remember anything, change what they like, or be able to afford anything extra. The public health record here is remarkable.
| Intervention | Target deficiency | Documented result |
|---|---|---|
| Salt iodization | Iodine | Most households worldwide now use iodized salt; goiter and iodine-deficiency disorders sharply reduced — strong evidence |
| Folic acid in enriched grain | Folate | Roughly 25–35 percent fall in neural tube defects where mandated — strong evidence |
| Vitamin D in milk | Vitamin D | Nutritional rickets became rare in fortifying countries — strong evidence |
| Thiamin, riboflavin, niacin, iron in flour | B vitamins, iron | Ended endemic pellagra and beriberi in industrialized countries — strong evidence |
| Biofortified staples (orange-fleshed sweet potato, iron beans, zinc wheat) | Vitamin A, iron, zinc | Good evidence for vitamin A status from orange-fleshed sweet potato; others still accumulating |
Two cautions keep fortification honest. First, it reaches only people who eat the fortified vehicle, so choosing the vehicle is a political and cultural decision as much as a technical one — fortifying wheat flour misses populations whose staple is rice, maize, or cassava. Second, more is not automatically better: nutrients have tolerable upper intake levels, and mandatory fortification plus voluntary fortification plus supplements can stack. Designing that ceiling correctly is the job of population-level policy, not individual dosing.
Community approaches and the limits of any one lever
Between national policy and the individual sits a large, creative middle layer: community gardens and urban farms, farmers-market incentive programs that double the value of federal benefits when spent on produce, campus and workplace pantries, gleaning and food-recovery networks that route edible surplus to people instead of landfills, mobile markets in low-access neighborhoods, and community-based management of acute malnutrition, which moved treatment of severe acute malnutrition out of hospitals and into homes using ready-to-use therapeutic food and dramatically improved survival and coverage.
What ties the effective interventions together is that they change the environment rather than lecturing the person inside it. Nutrition education has value — people deserve to understand their food — but knowledge is rarely the binding constraint. Income, price, distance, time, and safety usually are. The most useful posture for anyone working in this space is therefore to screen routinely, refer without judgment, know the local resources by name, and remember that a person skipping meals at the end of the month is responding rationally to their circumstances, not failing at nutrition.
- Benefit programs like SNAP work through purchasing power; WIC and school meals target high-risk windows; food banks supplement rather than replace income.
- Fortification and enrichment succeed because they require no behavior change — iodized salt, folic acid, vitamin D, and enriched flour are among public health's largest wins.
- Biofortification breeds nutrients into the crop itself; evidence is strongest for orange-fleshed sweet potato and vitamin A.
- Screen with the Hunger Vital Sign, refer without judgment, and target the environment rather than the individual's willpower.
The chapter in one breath
- Food security means reliable access to enough safe, nutritious, acceptable food, and rests on four dimensions: availability, access, utilization, and stability.
- Food insecurity is measured on a continuum (high, marginal, low, very low) and affects roughly one in eight U.S. households and about 2.3 billion people globally.
- Its health consequences are real and well documented — worse chronic disease control, poorer child development, higher rates of depression — and its association with higher body weight reflects cost and access, not character.
- Stunting marks chronic deprivation and wasting marks acute risk; the first 1,000 days is a genuine critical window, and iron, vitamin A, iodine, zinc, and folate drive most hidden hunger.
- Energy yields set the arithmetic of therapeutic feeding: fat 9 kcal/g, carbohydrate and protein 4 kcal/g, alcohol 7 kcal/g.
- The food system loses roughly a third of what it grows — about 13 percent before retail, 19 percent after — and "processed" describes both nutrient-preserving and nutrient-removing steps.
- Environmentally, what you eat matters far more than how far it travelled; ruminant meats sit at the high end of the footprint range, legumes and grains at the low end.
- Fortification, benefit programs, and community-level access outperform individual education, because they change the environment rather than the person's willpower.
ReferenceWords worth knowing
A quick reference for the terms in this chapter — skim it now, or circle back whenever a word trips you up.
- Biofortification
- Breeding or growing crops so the edible portion itself contains more of a nutrient, e.g., orange-fleshed sweet potato for provitamin A.
- Double burden of malnutrition
- The coexistence of undernutrition and diet-related chronic disease in the same population, community, or household.
- Enrichment
- Adding back nutrients that were lost during processing, such as restoring thiamin, riboflavin, niacin, folic acid, and iron to refined flour.
- Food apartheid
- A term emphasizing that unequal food access follows historical policy decisions about zoning, lending, and transit rather than natural geography.
- Food desert (low-access area)
- A neighborhood where distance to a full grocery store, combined with limited transportation, restricts access to a varied food supply.
- Food insecurity
- Limited or uncertain access to adequate food because of money or other resources; measured on a continuum, not as a yes-or-no state.
- Food Insecurity Experience Scale (FIES)
- An eight-item survey module used internationally to compare food insecurity across countries.
- Food security
- Access by all people at all times to sufficient, safe, nutritious, and acceptable food for an active, healthy life.
- Food system
- Everything from inputs and production through storage, processing, distribution, retail, consumption, and waste.
- Fortification
- Adding a nutrient to a food that did not originally contain it in that amount, such as iodine in salt or vitamin D in milk.
- Hidden hunger
- Micronutrient deficiency in a person consuming adequate calories.
- Hunger Vital Sign
- A validated two-question screener for household food insecurity, asking about worry that food would run out and food not lasting.
- Kwashiorkor
- Severe acute malnutrition presenting with bilateral pitting edema, fatty liver, and skin and hair changes; the classic protein-deficiency explanation is a heuristic, not settled science.
- Life-cycle assessment (LCA)
- A method that tallies environmental impacts across a product's whole chain, from inputs through disposal.
- Malnutrition
- Any deficiency, excess, or imbalance of energy or nutrient intake — it includes undernutrition, micronutrient deficiency, and diet-related chronic disease.
- Marasmus
- Severe acute malnutrition from grossly inadequate energy intake, marked by emaciation and loss of fat and muscle without edema.
- Mid-upper arm circumference (MUAC)
- A rapid field screening measure for acute malnutrition in children 6–59 months; a value below 115 mm indicates severe acute malnutrition.
- Planetary health diet
- A modeled reference eating pattern, largely plant-based with modest animal foods, designed to meet nutrient needs within estimated environmental limits.
- Ready-to-use therapeutic food (RUTF)
- An energy- and nutrient-dense paste, high in fat, used to treat severe acute malnutrition at home without added water or refrigeration.
- Refeeding syndrome
- Potentially fatal electrolyte and fluid shifts — notably falling phosphate, potassium, and magnesium — when nutrition is reintroduced to a severely malnourished person; managed medically.
- Stunting
- Height-for-age more than 2 standard deviations below the WHO growth standard median; a marker of chronic deprivation.
- Wasting
- Weight-for-height more than 2 standard deviations below the WHO growth standard median; a marker of acute deficit and high short-term mortality risk.